Data: The new currency
Published by: Pritee Verma
Data is called the new world currency nowadays. All users consume data in one way or another. Data surrounds us; it’s everywhere, on product labels, in an organisation’s reports, and in different equipment (sensors, controllers, etc.).
Sometimes it can be difficult to present data in an appropriate way. It’s especially so when it concerns complex data available in various formats. Data is only good when it’s presented in the right manner and to the right audience.
In organisations like this, we spend a lot of resources to gather massive amount of relevant and accurate data. But that, in itself, is not enough for this data to be interpreted correctly if it’s not presented in various flavours and to the prospective users.
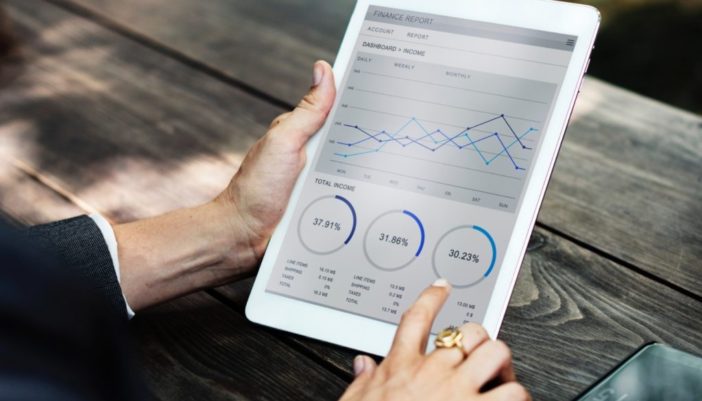
Data seen through the right visualisation tools not only gives deeper insights and helps better analysis but also eliminates risks of error and mis-interpretation. Advanced Visualisation techniques can reveal various KPI’s and performance indicators which can help Managers and Stakeholders take important decisions.

